Sunday, September 27, 2009
Over-simplicity.....
I am going to post a very over-simplified explanation of my trading technique. This will point out a few generalized deductions you can decipher through market pricing action.
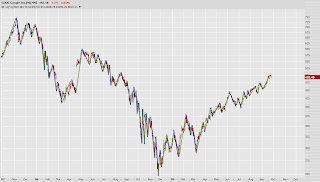
The chart above, a 2 year chart, displaying daily bars, on google is what I shall use for my generic sample. I have roughly outlined moves, in both directions. Up moves are displayed with a green line, down moves are displayed outlined in blue. These moves, whether up or down, are either extensions, compensatory (or corrective) moves, or both. What type of move is not outlines here.
A few generalized facts here. You can count, measure, etc, each and every move, but it will not prove too much usefulness, as mentioned, this is generic.
First, let's look at the upward impulses. These are the green lines. A basic fact is markets do not trade in one direction without compensation of some sort. The lines show this by their frequency and magnitude of their extensions. Smaller moves have a proportionatley larger frequency and larger moves have a decreasing amount of frequency within the chart. From this we can deduct the following statement: The higher the magnitude of the move, the greater the percentage chance of reversal becomes. To rephrase, eventually price action will correct, the more it moves in one direction, the closer the time comes to a meaningful correction.
These percentage moves, and their standard deviation of correction, can be applied to the broad market, or individual issues. Each traded issue has its own personality and degree of volatility concerning extension and correction. All individual issues fall within the guidlines of acceptable extensions and correction of the broad general market. For instance, if the broad market based rule is that no regulated issue can move greater than XX% without correcting XX%, each and every issue falls below this threshhold of extension and compensatory correction. The degree at which the indiviual issue falls below these tolerances are based on a volatility beta. Just a quick example, GS has a volatility beta 5 times greater than that of GOOG. This means, if GS can move XX% before correcting XX%, then GOOG can move (XX%/5) before correcting the same percentage amount as GS. Note: the extension is based on the volatility beta, not the percentage correction.
The downward moves, notated by blue lines behave in the same mannor. The difference between extensionary moves and compensatory moves is that extension build "obligation" in the counter direction. Compensatory moves due not build "obligation". In some rare instances, you will have a combination of a compensatory move which launches a new extension. This move compensates the prior move while building "obligation" once again in the direction of the first move. You may see this as a "dip" buying opportunity.
Let's take a look at a cycle a little closer.
As the cycle extends.... the percentage probabilty of retracement increases. As this percentage increases you can compile your position to increase leverage to exploit the due counter-move. Adding to a winning position increases leverage in the direction of the extension, when a counter, or corrective, move is obligatory. This is not what we want to do. Although, this is traditionally taught. When fading the trend, and the corrective move begins, we do nothing, except set our target exit.
As probability increases, leverage increases, the percentage of movement required to compensate the move remains constant. Although the percentage requirement to correct the move remains constant, the absolute price movement required increases. This is due to the further movement of the extension we are fading. For instance, a 20% counter move of a 50.00 run is 10.00. If the extension went 60.00, the correction you have played (20%) is now 12.00. As long as you have played your capital allocation appropriately and can continue to fade the trend, the due correction will make the trade profitable, and typically by a pretty substantial percentage return on the capital utilized. The longer you wait to enter the extension, the higher the return on capital utilized and the less agressive you need to be to keep the correction profitable.
Hope this gives you some information to digest. Enjoy the remainder of the weekend!

